Internet Information Services (IIS) brings your websites live with a robust infrastructure at fast speeds. Even the default configuration is optimized for speed, you may notice slowness loading your websites due to possible reasons such as the inefficient application code. Here are 5 performance counters I would recommend checking if you want to monitor the resource usage in your IIS server:
- Processor (All instances – % Processor Time): CPU consumption broken down by processes
- Memory (Available Mbytes): Available memory in OS
- HTTP Service Request Queues (CurrentQueueSize): The request count that is pending in the IIS queue
- .NET CLR Exceptions (# of Exceptions Thrown/sec): The count of System.NullReferenceException thrown by the applications
- APP_POOL_WAS (For all listed Application Pools):
- Current Application Pool State: allows you to see the state of application pools
- Current Application Pool Uptime: Allows you to see if the web application has been restarted or not
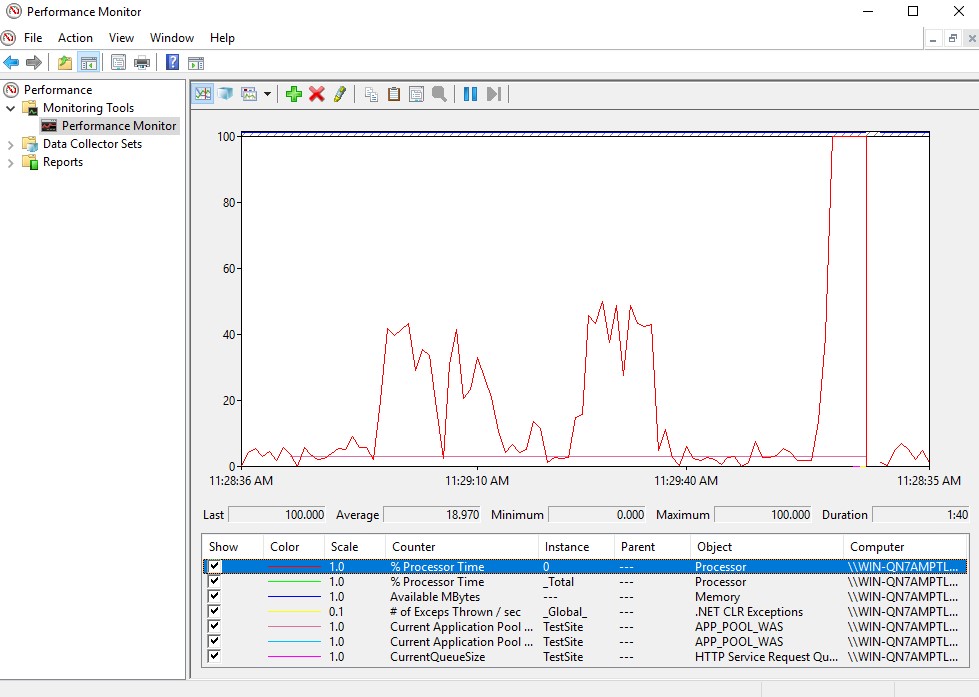
In order to monitor these counters, follow the steps below:
- Go to Start. Search for “Performance Monitor“
- Click on the green plus sign (+)
- Select a category (Processor, Memory etc.)
- Select a sub-category (% Processor Time, Available Mbytes etc.)
- Select an object (_Total, <All instances> etc.)
- Click “Add“
- Click “OK“
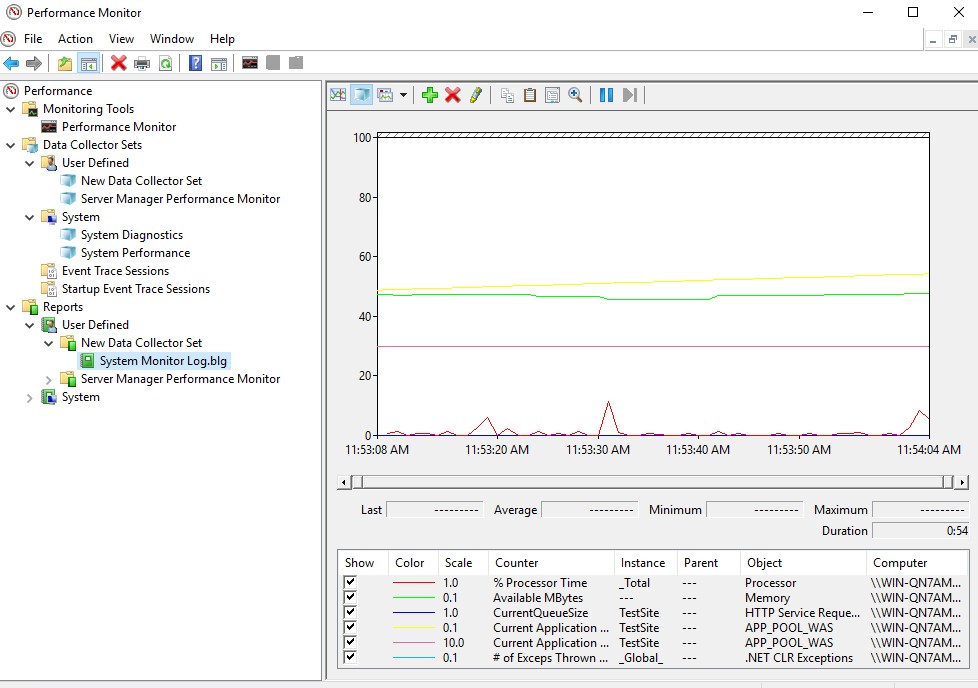
With these instructions, you can monitor the real-time statistics of your server. If you want to save these statistics:
- Right click on “Performance Monitor” under “Monitoring Tools” on the left side
- Select “New > Data Collector Set”
- Give a name and click “Next“
- Select a path to save the data and click “Next“
- Select “Start this data collector set now” and click “Finish“
- You will see an arrow icon on the collector set you created. It means it’s recording the logs. Once you have recorded for a desired time, right click on the collector set and select “Stop“
- You can go to the path you specified in Step 4 or you can click “Latest report” button (Green notebook icon) to see the report
If you are not happy with your server’s resource usage and you want to fine-tune IIS performance, check my detailed post: 9 Easy and Practical Recommendations to Improve IIS Performance
For more performance counters related to IIS and ASP.NET, check these posts out:
1 thought on “5 Useful Performance Counters to Monitor for IIS”
Comments are closed.